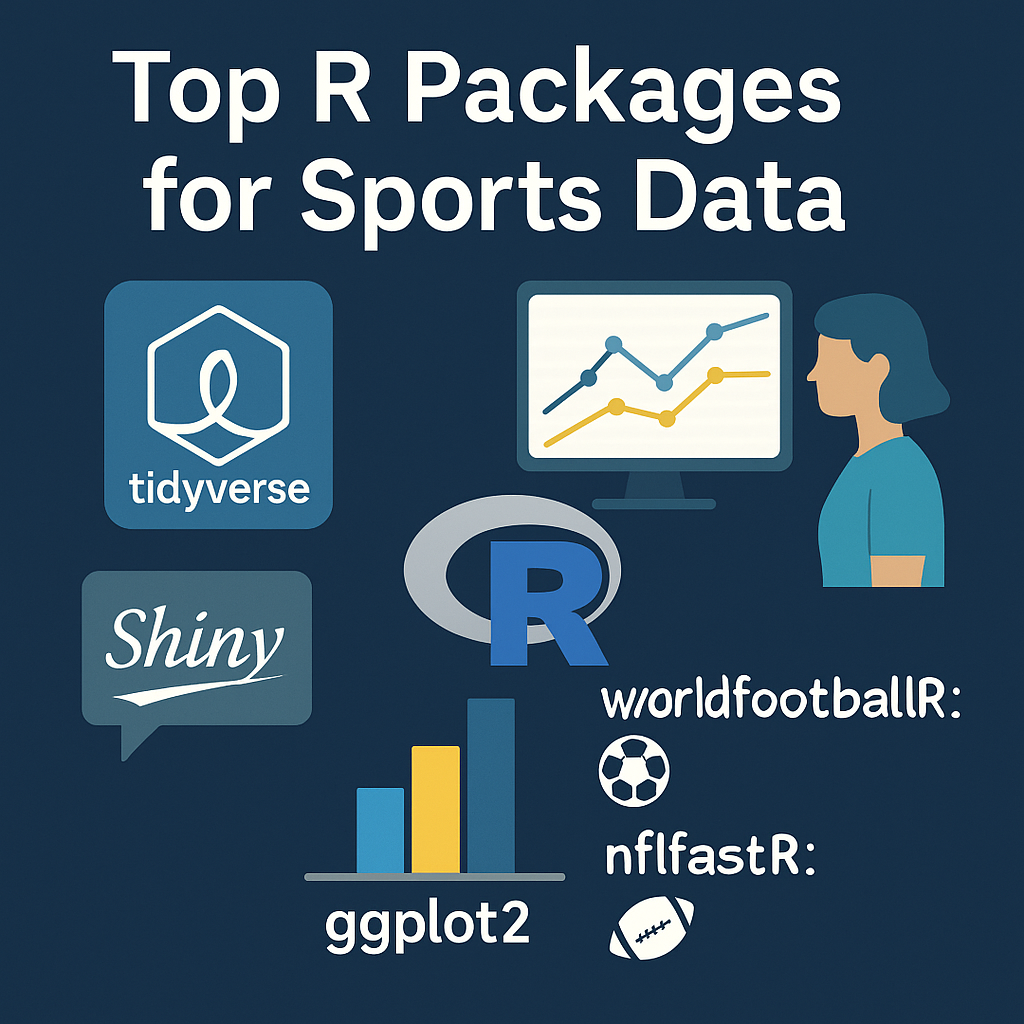
An overview of essential R libraries for sports analytics with examples.
tidyverse: Data Wrangling
The tidyverse is a collection of packages for data science. It includes dplyr, readr, and tidyr, making it a must for sports analytics workflows.
library(tidyverse)

# Example: filter a game log for one team
games %>%
  filter(team == "Lakers") %>%
  summarise(avg_points = mean(points))
ggplot2: Data Visualization
ggplot2 lets you create flexible and beautiful charts for sports data analysis.
library(ggplot2)

games %>%
  ggplot(aes(x = date, y = points, color = team)) +
  geom_line() +
  labs(title = "Team Points Over Time")
Shiny: Interactive Dashboards
Shiny is an R package that allows you to build interactive web apps and dashboards for sports data visualization.
library(shiny)

ui <- fluidPage(
  titlePanel("Team Points Dashboard"),
  sidebarLayout(
    sidebarPanel(selectInput("team", "Choose a team:", unique(games$team))),
    mainPanel(plotOutput("plot"))
  )
)

server <- function(input, output) {
  output$plot <- renderPlot({
    games %>% filter(team == input$team) %>%
      ggplot(aes(x = date, y = points)) +
      geom_line()
  })
}

shinyApp(ui, server)
worldfootballR: Soccer Data
worldfootballR provides access to soccer data from sources like FBref and Transfermarkt.
library(worldfootballR)

# Example: Get match results from the English Premier League
epl_results <- fb_match_results(country = "ENG", gender = "M", season_end_year = 2023)
head(epl_results)
nflfastR: NFL Play-by-Play Data
nflfastR is a package for analyzing NFL play-by-play data. Perfect for advanced football analytics.
library(nflfastR)

# Load data for 2022 season
pbp <- load_pbp(2022)

# Example: Calculate average yards gained per play by team
pbp %>%
  group_by(posteam) %>%
  summarise(avg_yards = mean(yards_gained, na.rm = TRUE))
Conclusion
From tidyverse for data wrangling to ggplot2 for visualization, Shiny for dashboards, and sport-specific libraries like worldfootballR and nflfastR, R offers a powerful ecosystem for sports data analysis. Start with tidyverse basics, add visualization, then explore sport-specific datasets to build robust analytics workflows.

