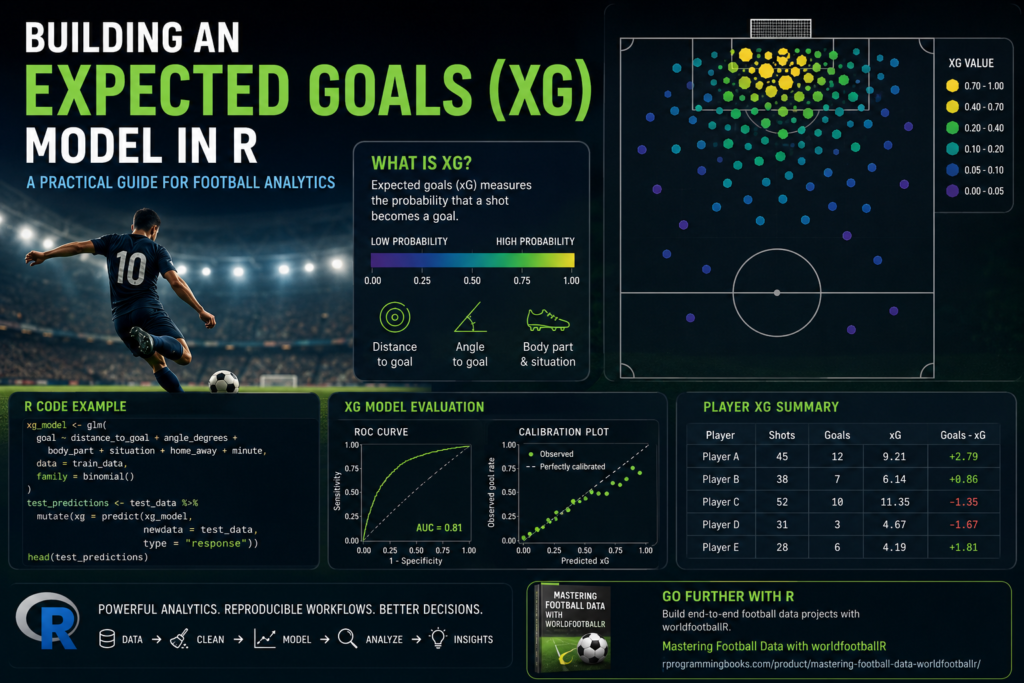
rprogrammingbooks

Rugby analytics with R showing performance analysis dashboards, win probability models, and match data visualization for Rugby Union and Rugby League

Rugby Analytics with R: Complete Guide to Performance Analysis in Rugby Union and League

Rugby is a sport defined by collisions, structure, and constant tactical adaptation. Unlike many other invasion sports, rugby alternates between highly structured moments—scrums, lineouts, restarts—and extended passages of chaotic open play. Each phase generates rich performance data: tackles, rucks, carries, kicks, meters gained, penalties conceded, turnovers, and spatial changes in territory. Despite this richness, rugby […]

Rugby Analytics with R: Complete Guide to Performance Analysis in Rugby Union and League Read More »

Cricket analytics in R visualizing ball-by-ball data, player performance metrics, win probability, and match insights using cricketdata

How to Analyze Ball-by-Ball Cricket Data in R (cricketdata)

Focus keyphrase: cricket analytics in R • Secondary: R cricket data analysis • Package: cricketdata Cricket analytics is no longer limited to season averages and simple leaderboards. With modern ball-by-ball datasets, we can quantify tempo, isolate phase-specific skills, evaluate matchups, and model outcomes under uncertainty. R is a strong environment for this work because it

How to Analyze Ball-by-Ball Cricket Data in R (cricketdata) Read More »

predicting nba games with R

Predicting NBA Games with R and hoopR (Win Probabilities + Heatmaps)

If you love sports analytics, this post will show you how to predict NBA matchups using real ESPN data and the R ecosystem — specifically hoopR, tidyverse, and ggplot2. We’ll use a simple Poisson model to simulate thousands of possible scores, compute win probabilities, and visualize expected outcomes for any matchup — all inside R.

Predicting NBA Games with R and hoopR (Win Probabilities + Heatmaps) Read More »

How to Analyze NBA Player Stats in R Using hoopR and ggplot2

Ever wondered how to pull and visualize NBA player stats using R?With just a few lines of code and the {hoopR} package, you can load real NBA data directly from ESPN and create professional-looking visualizations in minutes. Here’s how to build a quick chart of the Top 10 NBA Scorers (2023–24) using tidyverse and hoopR.

How to Analyze NBA Player Stats in R Using hoopR and ggplot2 Read More »

Square blue graphic featuring the R logo and the text ‘R Programming – Data Analysis & Modeling – Code Snippets | Data Science’, representing R programming for data analysis

200 R Programming Prompts & Code Snippets for Data Analysis and Modeling

R is a versatile programming language designed for statistical computing and graphics. It can act as a calculator, provide numerical and graphical summaries of data and handle a variety of specific analyses:contentReference[oaicite:0]{index=0}. Whether you’re exploring data, running statistical tests or building predictive models, R offers built-in functions and packages to streamline the workflow. The summary()

200 R Programming Prompts & Code Snippets for Data Analysis and Modeling Read More »

Abstract digital illustration of basketball analytics. A glowing basketball is surrounded by dynamic data visualizations, including circular charts, graphs, and network-like connections, symbolizing advanced sports statistics and performance analysis. The design uses a futuristic tech style with dark background and bright neon highlights.

From Data to Victory: Advanced Basketball Analytics with R

A hands-on tutorial with reproducible R code for play-by-play analysis, shot charts, and data-driven decision making. This post accompanies and expands on the book listed here: Basketball Analytics with R — Product Page Table of Contents Setup & Data Ingestion Cleaning and Tidy Structures Lineups and On/Off Impact Shot Charts and Efficiency Maps Pace, Four

From Data to Victory: Advanced Basketball Analytics with R Read More »

Square digital graphic comparing R and SQL for data science, featuring the R logo on the left, a database icon with SQL text on the right, and the central question: 'Do You Still Need SQL if You’re a Data Scientist in R?' on a deep blue background.

R vs SQL: Do You Still Need SQL if You’re a Data Scientist in R?

In analytics teams, the question often arises: “If I already know R, do I still need SQL?” The short answer is: yes—most of the time. R and SQL solve different—yet complementary—problems. SQL is the lingua franca for querying and shaping data where it lives (databases, data warehouses), while R excels at modeling, visualization, and reproducible

R vs SQL: Do You Still Need SQL if You’re a Data Scientist in R? Read More »

Square graphic comparing R and Julia for data science, featuring their logos with contrasting themes: R linked to visualization, Julia linked to speed, and the tagline 'Speed, Statistics, and the Future of Analytics' in bold typography

R vs Julia: Speed, Statistics, and the Future of Data Science

In the rapidly evolving world of data science and analytics, two languages stand out for statisticians and researchers: R and Julia. While R has been a trusted companion in statistical computing for decades, Julia has emerged as a modern language promising both speed and flexibility. This raises a crucial question: is Julia the future of

R vs Julia: Speed, Statistics, and the Future of Data Science Read More »

Square graphic comparing R and Python for data science, featuring logos of both languages, contrasting strengths like visualization and machine learning, in a clean data-science themed design.

R vs Python in 2025: A Complete Comparison for Data Science

In the world of data science, two programming languages dominate the conversation: R and Python. Both have powerful ecosystems, passionate communities, and proven success in real-world analytics. Yet the question persists: which language is better for data science? The truth is that both R and Python excel in different areas. Choosing the right tool often

R vs Python in 2025: A Complete Comparison for Data Science Read More »