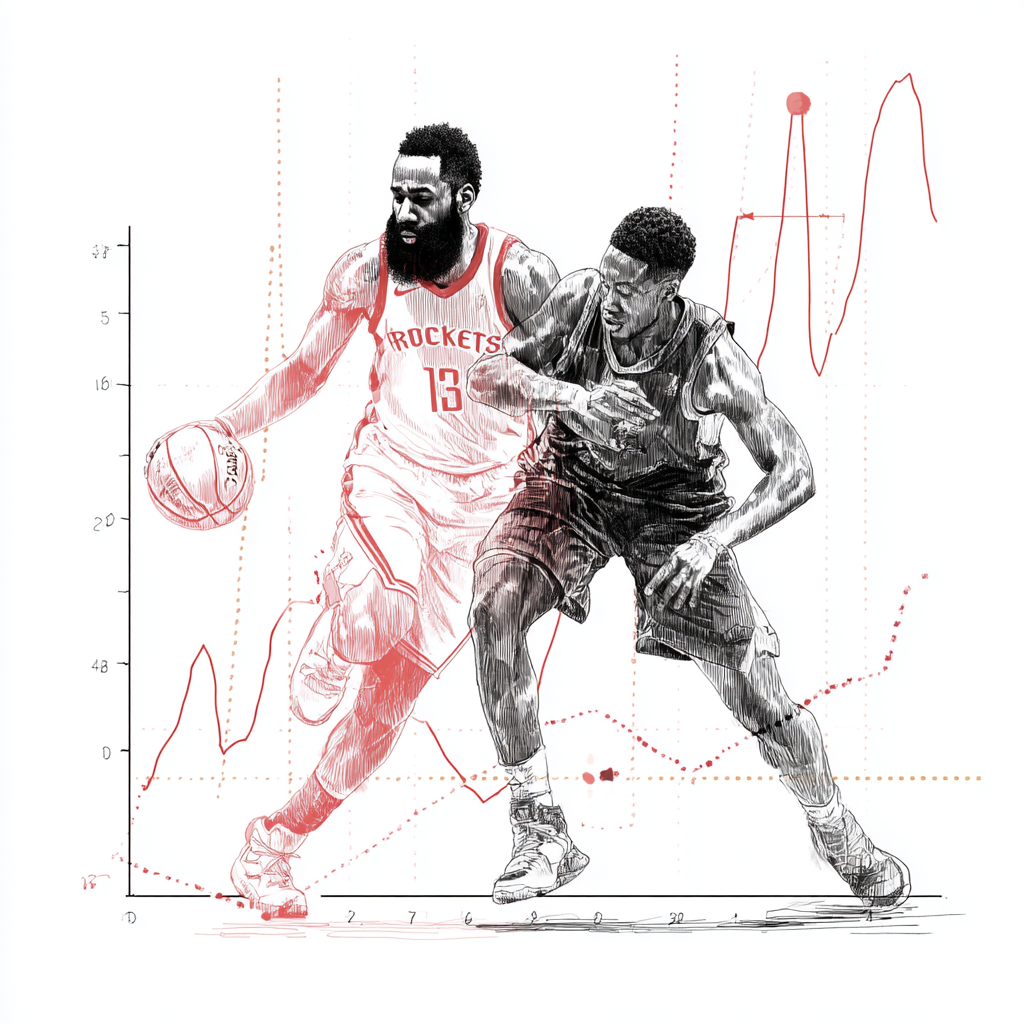
NBA Analytics with R: Player Performance, Team Strategy & Data Science
NBA analytics with R helps analysts, coaches, and data-driven fans turn raw basketball data into clear, repeatable insights. This guide outlines the full workflow—loading, cleaning, modeling, visualization, and reporting—and links to a hands-on ebook with annotated code and real datasets.
Why R for NBA analytics?
R brings cleaning, feature engineering, visualization, modeling, and reporting into one reproducible ecosystem. With NBA analytics with R, every step is scripted—easy to audit, refresh, and scale across seasons and rosters.
Data pipeline: load & clean
A solid project starts with tidy player-, team-, and game-level tables (IDs, seasons, lineups, possessions). Standardize timestamps, positions, and opponent context for consistent joins and seasonal comparisons.
library(dplyr)

players  <- read.csv("players.csv")
games    <- read.csv("games.csv")
boxscore <- read.csv("boxscore.csv")

box_clean <- boxscore %>%
  mutate(season = as.integer(season),
         mp = as.numeric(minutes_played)) %>%
  filter(mp > 0) %>%
  distinct(game_id, player_id, .keep_all = TRUE)
Advanced metrics in R (PER, TS%, USG%)
This ebook walks through calculating and interpreting advanced metrics to evaluate efficiency and role. In basketball data analysis in R, you’ll build reusable functions and document assumptions so calculations remain transparent.
# Illustrative TS% and USG% (simplified for demonstration)
calc_ts <- function(points, fga, fta) {
  ifelse((2*(fga + 0.44*fta)) > 0, points / (2*(fga + 0.44*fta)), NA_real_)
}

calc_usg <- function(fga, fta, tov, tm_minutes, player_minutes, tm_fga, tm_fta, tm_tov) {
  # usage approximates share of team possessions used
  poss_player <- (fga + 0.44*fta + tov) * (tm_minutes / 5) / pmax(player_minutes, 1e-9)
  poss_team   <- (tm_fga + 0.44*tm_fta + tm_tov)
  ifelse(poss_team > 0, poss_player / poss_team, NA_real_)
}

box_clean <- box_clean %>%
  mutate(ts_pct = calc_ts(pts, fga, fta))
From PER to lineup synergy, the guide shows how to compare roles, quantify shot quality, and contextualize usage versus efficiency.
Visualization: trends & roles
Use quick, readable charts to track season-over-season performance, role changes, and lineup effects. With R programming for basketball, you can surface patterns that inform coaching decisions and scouting.
library(ggplot2)

ggplot(box_clean, aes(x=season, y=ts_pct, group=player_id)) +
  geom_line(alpha=.15) +
  stat_summary(fun=mean, geom="line", size=1.1) +
  labs(title="League-wide TS% trend by season")
Predictive modeling
Start with interpretable baselines (linear/logistic regression), then extend to tree-based or gradient models if they improve accuracy without sacrificing clarity. In NBA data science with R, you’ll learn validation, drift checks, and versioning so models evolve with fresh data.
library(tidymodels)

set.seed(123)
split <- initial_split(box_clean, prop=.8, strata = ts_pct)
train <- training(split); test <- testing(split)

rec <- recipe(ts_pct ~ fga + fta + threepa + ast + tov + orb + drb + mp, data=train) %>%
  step_normalize(all_numeric_predictors())

mod <- linear_reg() %>% set_engine("lm")
wf  <- workflow() %>% add_recipe(rec) %>% add_model(mod)

fit <- fit(wf, train)
pred <- predict(fit, test) %>% bind_cols(test)
metrics(pred, truth = ts_pct, estimate = .pred)
Dashboards & reporting
Translate models and metrics into concise dashboards: one metric per chart, short insights, recommended actions. Keep refreshable reports after each game or week—this is how R basketball programming turns analysis into decisions.
Get the complete guide
Move from theory to practice with commented code, templates, and real NBA case studies. Download it here:
Mastering NBA Analytics with R – Data Science for Basketball Performance and Strategy
Inside: 62 pages of hands-on guidance, advanced metrics (PER, TS%, USG%, AST/TO), season and team visualizations, clustering and regression models, and dashboard patterns using tidyverse and compatible modeling packages.

